Average Cost of Groceries Per Month 2026
USDA benchmarks by household size, updated for 2026 — know in 10 seconds whether your bill is normal. Compare your own number free with GroceryBudget.
Key Takeaways
• USDA food plans show monthly grocery spending ranges from ~$230 (single, thrifty) to $1,800+ (family of 5, liberal plan).
• Most households underestimate their spending by 20-30% because quick stops and split purchases don't show up in their mental model.
• Knowing where you stand vs. USDA benchmarks tells you whether to cut, hold, or stay the course — but you need accurate numbers first.
You probably have only a vague sense of whether you're spending a normal amount on groceries. You know roughly what your monthly bill is, but you don't have a reference point for whether that's reasonable, high, or unusually low for your household size.
The USDA publishes monthly food cost estimates that give you exactly that benchmark. Here's what the data looks like and how to use it.
The USDA Food Plans
The USDA produces four monthly food cost estimates for U.S. households: the Thrifty Plan, Low-Cost Plan, Moderate-Cost Plan, and Liberal Plan. These estimates represent what it costs to feed a family at home at different spending levels, assuming meals are home-cooked from scratch.
A few things to understand about these benchmarks:
- They cover food at home only — not restaurants, takeout, or food delivery
- They're adjusted monthly for food price inflation
- They're based on typical nutritional recommendations, not specific diets
- They assume a reasonable level of food preparation skill and meal planning
The USDA updates these figures regularly. The numbers below reflect recent estimates and are directionally accurate for 2026, though actual figures shift with inflation.
Benchmarks by Household Size
Single Adult (19-50 years old)
| Plan | Monthly Estimate |
|---|---|
| Thrifty | ~$230-260 |
| Low-Cost | ~$310-340 |
| Moderate-Cost | ~$380-420 |
| Liberal | ~$470-520 |
Couple (two adults, 19-50 years old)
See also: Grocery budget for couples — what's realistic and how to stick to it.
| Plan | Monthly Estimate |
|---|---|
| Thrifty | ~$430-480 |
| Low-Cost | ~$580-640 |
| Moderate-Cost | ~$720-790 |
| Liberal | ~$890-980 |
Family of 3 (two adults + one child, or one adult + two children)
See also: Average grocery cost for a family of 3 in 2026 — why three-person households often overspend and what to do about it.
| Plan | Monthly Estimate |
|---|---|
| Thrifty | ~$520-570 |
| Low-Cost | ~$670-730 |
| Moderate-Cost | ~$830-910 |
| Liberal | ~$1,020-1,110 |
Family of 4 (two adults + two school-age children)
See also: Grocery budget for a family of 4 per week — weekly breakdown with what each spending tier actually buys.
| Plan | Monthly Estimate |
|---|---|
| Thrifty | ~$820-900 |
| Low-Cost | ~$1,090-1,200 |
| Moderate-Cost | ~$1,350-1,490 |
| Liberal | ~$1,630-1,800 |
Family of 5 (two adults + three children)
| Plan | Monthly Estimate |
|---|---|
| Thrifty | ~$1,000-1,100 |
| Low-Cost | ~$1,330-1,470 |
| Moderate-Cost | ~$1,660-1,830 |
| Liberal | ~$2,000-2,200 |
Note: these are rough estimates based on recent USDA data. Actual figures vary by region, the specific ages of children in your household, and current food prices.
What Each Tier Actually Means
Thrifty Plan: The lowest realistic spending level that still meets nutritional guidelines. Requires significant meal planning, buying in bulk, minimal food waste, using cheaper protein sources, and cooking mostly from scratch. Not easy to sustain long-term without real effort.
Low-Cost Plan: More flexibility than Thrifty, but still requires deliberate choices. You can buy most of what you need without agonizing over every item, but there's not much room for premium brands or convenience foods.
Moderate-Cost Plan: This is roughly where most middle-income U.S. households land when they're being reasonably thoughtful about spending. Room for some convenience foods, a wider variety of proteins, and occasional premium items.
Liberal Plan: Reflects spending without significant budget constraints — more variety, better-quality cuts of meat, organic options, premium brands, and minimal concern about food cost optimization.
How to Figure Out Where You Actually Stand
Most people think they know what they spend on groceries. They're usually wrong by 20-30%.
The number in your head is often based on your biggest weekly shopping trip, which doesn't account for:
- Mid-week "quick stops" that add $20-30 each
- Gas station and convenience store food purchases
- Splitting grocery costs across multiple payment methods
- Items bought for the household at big-box stores (Costco, Target) that blend with other spending
Before you can know whether you're over or under the benchmark for your household, you need an accurate number.
Track every grocery-related purchase for four weeks. Include the main shopping trip, quick stops, and anything you'd classify as food bought for home. At the end, multiply by three to get an approximate monthly figure (or add up the full month if you track that long).
Then compare to the USDA benchmark for your household composition.
What the Comparison Reveals
If you're spending significantly below the Thrifty Plan: you may be under-spending in a way that's affecting your diet, or you're not tracking all food purchases accurately.
If you're at or below the Low-Cost Plan: you're managing your grocery budget well. There's probably not much room to cut without making real sacrifices.
If you're in the Moderate range: you're in the middle. Whether that's the right level for your household depends on your income and financial priorities.
If you're consistently above the Liberal Plan: you're spending more than most households with similar compositions. That's not necessarily wrong — higher food spending can reflect dietary needs, high-quality ingredients, or specific lifestyle choices — but it's worth understanding whether it's intentional or the result of habits you haven't examined.
Why Most Households Overspend
A few patterns come up repeatedly when people actually track their grocery spending:
Quick trips cost more per item than planned shops. When you go in for "a few things," you rarely leave with just a few things.
Convenience pricing adds up. Pre-cut vegetables, single-serve packaging, and prepared foods can cost 40-60% more than their whole equivalents.
Waste erases savings. The USDA estimates that the average U.S. household wastes 30-40% of the food it buys. Buying cheaper groceries that get thrown out doesn't save money.
Store choice matters more than brand loyalty. The same basket of goods can cost 20-25% more at a premium supermarket than at a discount grocer — see Walmart vs Aldi for exactly how much that adds up to by item.
Using GroceryBudget to Find Your Baseline
If you're still looking for the right app to track this, see our breakdown of the best grocery budget apps of 2026 — it covers which ones actually track spending vs. which just make lists.
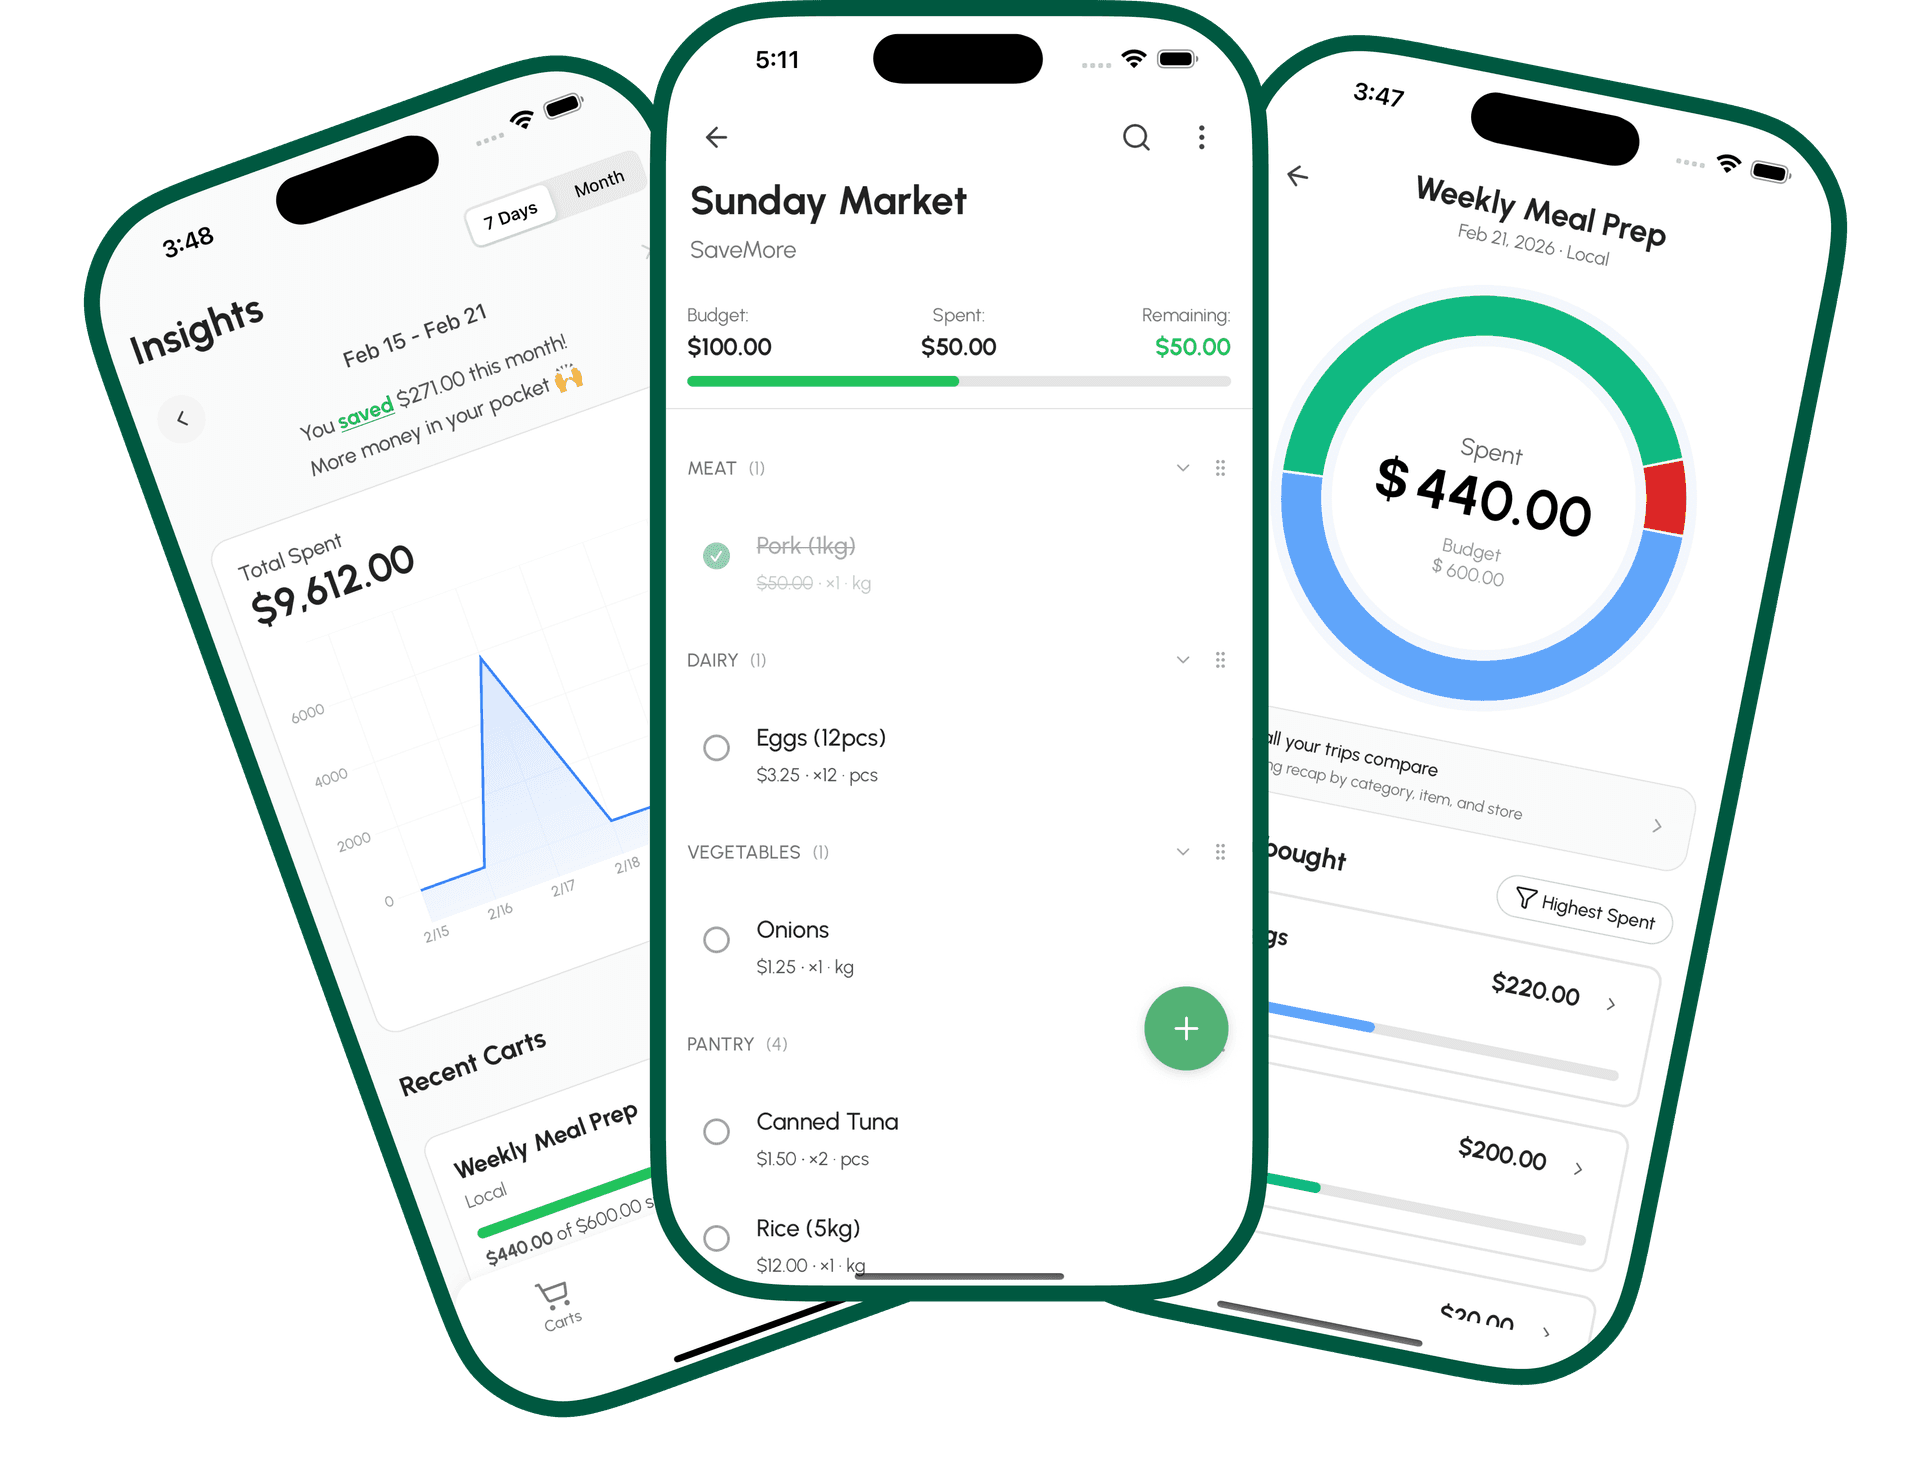
The grocery budget app shows your total grocery spending by week and month, broken down by category (produce, meat, dairy, etc.). After a month of consistent tracking, you'll see where your money actually goes — not where you think it goes.
The free tier includes 7 days of insights history, which is enough to start seeing patterns. Premium unlocks your full spending history, so you can track trends over months and compare periods directly.
The goal isn't to hit a specific USDA number. The benchmarks are useful for context, not as hard targets. But knowing where you stand relative to those benchmarks — and understanding what's driving your spending — puts you in a position to make intentional choices rather than guessing.
That's the difference between a grocery budget that exists on paper and one that actually works.
---
Related: Grocery budget for couples — benchmarks and shared budgeting tips for two. Average grocery cost for a family of 3 — why three-person households overspend. Grocery budget by income — percentage-based targets by salary level. Walmart vs Aldi and Walmart vs Kroger — which store actually saves you more.
Frequently Asked Questions
How much should I spend on groceries per month?+
USDA benchmarks range from about $230 per month for a single adult on the Thrifty plan to $1,800+ for a family of five on the Liberal plan. Find your household size and target spending level, then compare it to what you actually spend.
What percentage of income should go to groceries?+
A common guideline is 10–15% of take-home pay, though this rises for lower incomes and larger households. Treat it as context, not a hard target.
How do I know if I'm overspending on groceries?+
Track a full month of grocery spending, including quick top-up trips, then compare it to the USDA benchmark for your household size. Spending well above it with a lot of food waste is the clearest sign.